
Benchmarking FutureSDR
The introductory video of FutureSDR already showed some quick benchmarks for the throughput of message- and stream-based flowgraphs. What was missing (not only for FutureSDR but for SDRs in general) were latency measurements. I, therefore, had a closer look into this issue.
While throughput can be measured rather easily (by piping a given amount of data through a flowgraph and measuring its execution time), latency is more tricky. The state-of-the-art is to do I/O measurements, where the flowgraph reads samples from an SDR, processes them, and loops them back. Using external HW (i.e., a signal generator and an oscillator), one can measure the latency.
The drawback of this approach is obvious. It requires HW, a non-trivial setup, is hard to automate and integrate in CI/CD.
An alternative is measuring latency by logging when a sample is produced in a source and received in a sink. The main requirement for this measurement is that the overhead must be minimal. Otherwise, one easily measures the performance of the logging or impacts the flowgraph in a way that its behavior is no longer representative for normal execution.
There are many possible solutions (like logging to stdout, a file, or a ramdisk) or using eBPF (uprobes or USDTs). However, they all introduce considerable overhead or require significant manual tuning and optimizations (e.g. logging to a ramdisk needs to be synchronized and should ideally use a binary format; uprobes and USDTs trigger a context switch to the kernel, etc.).
LTTng allows probing user space applications with minimal overhead. It uses one ring buffer per CPU to log custom events in a binary format. Furthermore, there are tools and libraries available to evaluate the traces.
The main drawback of LTTng is that it is only available on Linux and requires adding tracepoints to the code. The latter is easily possible for GNU Radio and FutureSDR by adding custom sources and sinks that provide these tracepoints.
The underlying idea is to define a granularity and issue TX/RX events when granularity samples are produced/consumed in the source/sink. One then correlates the events in post-processing to calculate the latency.
The work function of the modified Null Source, for example, checks if self.probe_granularity samples were produced and, in case, issues a tracepoints::null_rand_latency::tx event that is logged by LTTng.
async fn work(&mut self, _io: &mut WorkIo, sio: &mut StreamIo, _mio: &mut MessageIo<Self>, _meta: &mut BlockMeta) -> Result<()> {
    let o = sio.output(0).slice::<u8>();
    unsafe {
        ptr::write_bytes(o.as_mut_ptr(), 0, o.len());
    }

    let before = self.n_produced / self.probe_granularity;
    let n = o.len() / self.item_size;
    sio.output(0).produce(n);
    self.n_produced += n as u64;
    let after = self.n_produced / self.probe_granularity;

    if before != after {
        tracepoints::null_rand_latency::tx(self.id.unwrap(), after);
    }
    Ok(())
}
For GNU Radio, we created a Null Source in a similar manner.
I checked the overhead for FutureSDR executing a flowgraph (1) without LTTng tracepoints, (2) with disabled tracepoints, (3) with enabled tracepoints. Adding the tracepoint and the checks if granularity samples were produced adds ~4% overhead. Actual logging didn’t introduce a sizeable difference for a granularity of 32768 float samples.
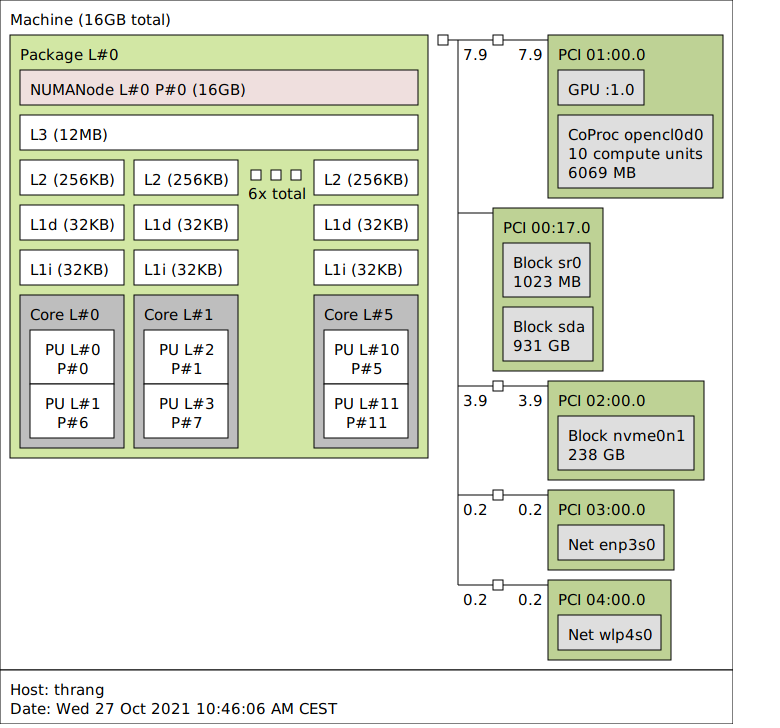
The measurements were conducted, following the methodology described in [1]. In short, we created a CPU set for the measurements and orchestrated the process through a Makefile. We allocated 3 cores with their hyper-threads to this CPU set. On my system these were “CPUs” 0, 1, 2, 6, 7, and 8.
We evaluated flowgraphs with 6 parallel Pipes and a configurable number of Stages.

The Sources are modified Null Sources followed by Head blocks to limit the data that is produced, allowing a graceful shutdown. The blocks that form the Stages just copy floats from input to output buffers. To avoid fixed, boring schedules, they copy only up to 512 samples at a time, with the actual value uniformly distributed between 1 and 512 samples.
For FutureSDR, we tested the Smol scheduler, which spawns one thread per CPU available to the process (in this case 6). The tasks (corresponding to blocks) are processed by a work-stealing scheduler that is unaware of the flowgraph topology. The Flow scheduler, in turn, has tasks associated to worker threads and processes them round-robin from upstream to downstream blocks, i.e., it exploits knowledge of the flowgraph topology.
Latency measurements with this setup provided the following results. Note that the error bars do not indicate noisy measurements but plot the 5% and 95% percentile of the latency distribution.

All tools and evaluation scripts are available here. Feel free to try it on your system with different parameters. For now, I would take these results with a grain of salt, but I believe that LTTng is a good option for latency measurements.
References
- Bastian Bloessl, Marcus Müller and Matthias Hollick, "Benchmarking and Profiling the GNU Radio Scheduler," Proceedings of 9th GNU Radio Conference (GRCon 2019), Huntsville, AL, September 2019. [BibTeX, PDF and Details...]